
Common Core is a Corporate Takeover of Education
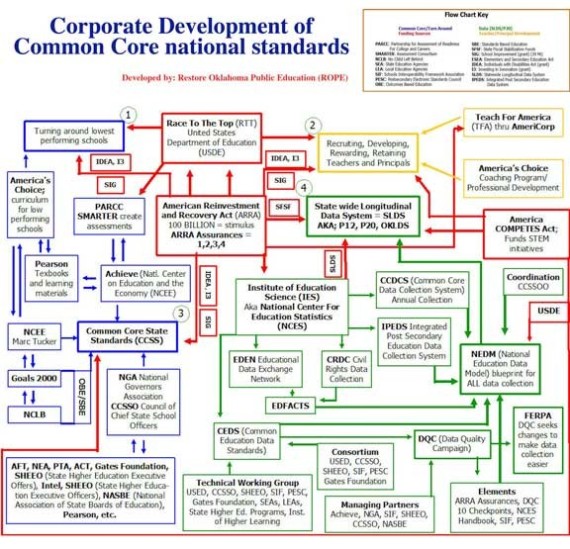
The chart below will give you an overview of WHO developed the standards for the education of our children. Notice who you will NOT see involved: parents, teachers, or the elected representatives of the people. NOTE: The two organizations that the proponents of Common Core point to as the “state led” creators of Common Core, the National Governor’s Association and the Council of Chief State School Officers, are private TRADE ORGANIZATIONS and have no constitutional authority to determine the education standards of our children. These organizations are not subject to any of the laws that our governmental committees are subject to such as open records, financial audits, and open meetings known as the “Sunshine Laws.”
Learn more about the National Governors Association… perhaps we should all learn more about this group’s role in changing our system of education from community schools with parental involvement to government run schools with corporate control.
WHO IS FUNDING COMMON CORE? BILL GATES!

Adobe Acrobat document [1.1 MB]
A “Common Core” for a Global Community
The goal of education has changed! Our schools no longer teach the kind of literacy, history, math, and morality that we once considered essential to responsible citizenship. The new generation of post-modern students are being trained to believe whatever might serve a pre-determined ‘common good.’
If their educators succeed, tomorrow’s students will have neither the facts nor the freedom needed for independent thinking. Their “common core” will be based on a global collective agenda, not on American freedom or Christian values. Like Nazi youth, they will be taught to react, not think, when nudged to do the unthinkable.
Dr. Thomas Sowell summarized this mind-changing process in a 1993 article titled “Indoctrinating the Children”:
“The techniques of brainwashing developed in totalitarian countries are routinely used in psychological conditioning programs imposed on American school children. These include emotional shock and desensitization, psychological isolation from sources of support, stripping away defenses, manipulative cross-examination of the individual’s underlying moral values, and inducing acceptance of alternative values by psychological rather than rational means.”
FreedomProject presents: Common Core – Dangers and Threats to American Freedom and Education 1 hour presentation as well as testimony from education experts explaining the standards to legislators.
Classical Education vs. Common Core (15 minute video)
Understand the difference between the classical education that made our nation great and the progressive, secular education of Common Core.
Common Core State Standards – Will You Be Assimilated?
This is a general overview of the Common Core State Standards covering their genesis, the cost, Race to the Top, the Standards themselves and finally how they will affect home schoolers. Though eRate and school bonds are discussed, ROPE completely understands and appreciates the position of rural schools who have been given an unfunded mandate to comply with the law of the Common Core. They simply do what they have to do to stay in compliance. This talk also details how Republicans have gotten behind this movement and are doing so even though the majority of the party is not in favor of the Standards. (25 minutes)
Common Core State Standards; What Do They Mean To You?
This is an overview of the Common Core State Standards from the mythology that they were ‘state led’ to the interesting notion that David Coleman himself wrote the standards and then ‘sold’ them to patsy Republicans. Data collection is also covered. (40 minutes)
Common Core State Standards – An Introduction To Marxism 101
A brief history of public education from the beginning of the 1900’s to now – particularly in the area of creation of public school curriculum standards. A video of the presentation we give from our paper of the same name, this piece of research provides much of the genesis for the types public school ‘reform’ we are currently seeing. Sadly, public education has gone from the practice of educating children in order for them to read the Bible and learn about the founding of our great country, to the practices of educating children by the collective, for the collective, of the collective. Children as workers… isn’t that what Marx desired? (1 hour, 15 minutes)
The following article does not reflect the mission of Operation Jericho Project to remove children from government schools. However, it does present the unvarnished truth about the origins of Common Core.
Let’s Get Off the National Standards Train
by Henry W. Burke and Donna Garner
(updated 2/2011)
INTRODUCTION
Let’s pose a question. If you wanted to “sell” something that a number of people did not need, how would you do it? You might try setting up a contest where everyone competes for a significant financial prize. After all, Americans love to compete, especially when money goes to the winner.
Here are the contest details: The competitors are strapped for cash; the competitors must give up some of their prized possessions in order to qualify; and the game organizers do not announce all of the rules until the game is well underway. How fair does this sound?
This is exactly what Barack Obama and U. S. Secretary of Education Arne Duncan have done with Common Core Standards (CCS) and Race to the Top (RTTT).
Under Obama and Duncan, the federal takeover of our schools is rapidly spreading across our nation.
It is not too late for the “contestants” to quit playing this game. States that have taken no federal Common Core Standards (CCS) money can drop out of the game. Even states that have received some of their Race to the Top (RTTT) funds could make a plea to Congress to pass a “hold harmless” clause that would allow these states some relief.
The questions that states must answer are, “Do we really want the federal government taking control of our public schools? How much will it cost the cash-strapped states to handle the extra expense of CCS / RTTT?”
[Please note — The major update to this report is the addition of a new Section — D. RTTT and Per-Pupil-Spending]
This report includes the following sections:
A. Origin of Common Core Standards (CCS)
B. Money and Race to the Top (RTTT)
C. Race Winners
D. RTTT and Per-Pupil-Spending
E. States That Adopted Common Core Standards
F. Federal Control of Education
G. Quality of Common Core Standards
H. Assessments
I. Follow the Money Trail
J. Congressional Hearings on Common Core Standards
K. Legality of CCS and RTTT
Conclusion and Action Steps are included at the end of this report.
A. Origin of Common Core Standards (CCS)
The Common Core State Standards Initiative (CCSSI) project (a.k.a., CCS for short) is an effort to establish national standards for all K-12 public schools. The two organizations that are leading the CCS project are the National Governors Association (NGA) and the Council of Chief State School Officers (CCSSO).
The NGA is a “bipartisan organization of the nation’s governors that speaks with a unified voice on national policy.” The CCSSO is “a nationwide, nonpartisan, and nonprofit membership organization…made up of states’ chief school officers.”
The Common Core State Standards Initiative (CCSSI) is part of the United States Department of Education’s federal Race to the Top (RTTT) contest.
Other non-governmental organizations also heavily involved in the CCSSI project are: Marc Tucker, the Bill & Melinda Gates Foundation as a major sponsor of the project, and Achieve, Inc., as a principal advocacy organization.
No Congressional public hearings have been held on CCSSI/RTTT nor have any been announced for the future. (One Congressional hearing, to be discussed later in this paper, was held on 12.08.09; but only invited guests were allowed to testify.) No Congressional votes by those we elected to represent us were ever taken on the CCSSI/RTTT.
The people chosen to write the Common Core Standards (CCS) documents are closely aligned with the Obama administration. Of course, the administration has tried to make it look as if the standards/curriculum/assessments are coming from the private sector; but the people chosen to write these CCS documents are all tied together.
B. Money and Race to the Top (RTTT)
When Secretary of Education Arne Duncan inserted a half-page program description into the Stimulus Bill in early 2009, few people except top Democratic leaders knew that it would create Race to the Top. This “Race” dominated the education news in 2010 because of the potential money that states could receive. Using a combination of the carrot-and-stick approach, the Obama administration has pressured states to adopt the national standards.
In Bill Costello’s comments (9.22.10), he captured the strings attached to taking the federal money:
http://www.americanthinker.com/2010/09/the_federal_takeover_of_educat.html
As an incentive, states that adopted the Common Core by August 2, 2010 greatly improved their chances of receiving a share of the $4.35-billion Race to the Top federal grant. The strategy worked: most states adopted the standards. However, only nine states and the District of Columbia were actually awarded the money [in Phase 2]. All ten of those winners had adopted the standards.
As a penalty, states that failed to adopt the Common Core risked losing funding from Title I, a $14.4-billion program that provides funds for low-income students. Most school districts participate in the Title I program.
States spent millions of dollars and many hours filling out the complicated RTTT applications. According to the U.S. Department of Education’s website, it took states an average of 642 hours to complete each application. That means it took two staff members, working full-time for two months (doing nothing else but working on the RTTT application), to finish the task.
In her article on 1.26.11, Michelle Malkin captured some of this effort and the role of teachers’ unions:
http://www.investors.com/NewsAndAnalysis/Article.aspx?id=560985&p=1
You need a chain saw to cut through the bureaucratese of the winning state applications, but the bottom line is that the ‘race’ is ‘won’ only when school reformers get buy-in from the teachers’ unions — the most stalwart enemies of introducing choice and competition to the atrophying system.
Robert Holland wrote an article on the RTTT’s hidden price tag(11.04.10).
In addition, local and state bureaucrats who competed for RTTT grants like a pack of wolves snapping at juicy pork chops are finding the grants may cost more than they bring in.
Given that the loot will be dribbled out over a four-year period, it is entirely possible that bureaucratic costs will consume any presumed windfall and localities will have to foot the bill to keep the promises they made to Washington.
In Massachusetts the State Board of Education voted to replace the Commonwealth’s best-in-the-nation academic standards with inferior quality national standards and assessments. The $250 million award calculates out to be $64 per student per year, over the four-year period. “The federal grant we won amounts to 44 cents a day per student for the next four years. And for that rather miserly investment, what did Massachusetts get?” (Jim Stergios, 11.24.10)
When the Texas Education Agency calculated how much the state would have received from Race to the Top (if Texas had decided to apply for RTTT), it amounted to a paltry one-time grant of around $75 per student. States that “won” RTTT funds received similar amounts.
Thankfully, Texas Gov. Rick Perry and Commissioner of Education Robert Scott told Washington, D. C. — “Not interested in Common Core Standards nor in Race to the Top.”
California has also found that Race to the Top amounts to an unfunded federal mandate. On 12.20.10, Doug Lasken (a retired Los Angeles Unifiedteacher and consultant) wrote:
http://www.dailybreeze.com:80/editorial/ci_16905517
It is in this context that we need to take a hard look at the costs we incurred under the Schwarzenegger administration when we accepted provisions of President Barack Obama’s education initiative, Race to the Top, an unfunded mandate of the first order, costing millions and not at all essential.
But Gov. Arnold Schwarzenegger and the legislature agreed to drop our standards, and then found that the state had been rejected by Race to the Top and would get no money. This means we must cover the costs of all the changes made to qualify for a race we didn’t win. There are a variety of estimates of the costs we walked into, but what they have in common is that they will come to many millions of dollars.
Consider that the “Schiff-Bustamante” bill passed in 1998 allocated $1 billion over four years to pay for textbooks aligned with the then-new California standards, in addition to the $70 million per year already allocated for textbooks. Grim projections come as well from the nonprofit EdSource, which estimates $800 million for new curriculum frameworks, $765 million for training teachers and $20 million for training principals, plus assorted minor costs, coming to a total of $1.6 billion.
How expensive would implementation of the CCS really be? Let’s use Lasken’s figures for California (cited again in an article on 1.23.11).
http://www.dailynews.com/opinions/ci_17168645
$800 Million for new curriculum
$765 Million for teacher training
$20 Million for training of principals
Total = $1.6 Billion
However if California had “won” in the RTTT competition, California would have received a maximum of $700 Million. According to the USDOE Budget Requirements, Category 1 states could receive $350 Million – $700 Million. The states in this Category are: California, Texas, New York, and Florida.
How could a $700 Million RTTT award cover the implementation cost of at least $1.6 Billion? Obviously, California would be on the hook to cover the shortfall; and the same thing will happen to any state that tries to implement the CCS.
[Note — This FY 2012 Budget information is an update to the report.]
Obama submitted his Fiscal Year 2012 budget on 2.14.11. This budget provides $77.4 billion for the Department of Education. It includes $1.4 billion for RTTT and a whopping $26.8 billion for a reformed Elementary and Secondary Act (ESEA)! (Please note that the White House announcement uses the $1.4 billion figure for RTTT.)
The White House press release for the Education Budget stated this about RTTT:
http://www.whitehouse.gov/sites/default/files/omb/budget/fy2012/assets/education.pdf
Adapts the Race to the Top Model of Competition to Transform Lifelong Learning. Widely viewed as leveraging more change than any other competitive education grant program in history, the Race to the Top (RTT) initiative spurred States across the Nation to bring together teachers, school leaders, and policymakers to achieve difficult yet fundamental improvements to our education system.
Clearly, the Obama administration will use the RTTT funds and ESEA funds (billions of dollars) to indoctrinate our public school children. Common Core Standards and Race to the Top are the vehicles to further their agenda.At this point, the final FY 2012 budget amounts have not been determined. Obama and Duncan may not get everything they want. With Republicans now in control of the House of Representatives, Obama no longer has an unlimited credit card!
C. Race Winners
Arne Duncan announced the two Phase 1 RTTT “winning” states on 3.29.10 and the ten Phase 2 winners on 8.24.10. The 12 states selected were: Delaware, District of Columbia, Florida, Georgia, Hawaii, Maryland, Massachusetts, New York, North Carolina, Ohio, Rhode Island, and Tennessee.
http://www2.ed.gov/programs/racetothetop/index.html
These states “won” the right to have their students thoroughly indoctrinated by the federal government because they are taking the federal funds from Race to the Top.
Could a state that has received an RTTT award drop the Common Core Standards? It is unlikely [but not impossible — please see conclusion at the end of this paper] that a state would be able to pull out unless it repaid the federal funds. On 1.11.11, Catherine Gewertz explained:
http://blogs.edweek.org/edweek/curriculum/2011/01/guidance_on_rtt_–_httpwwwedwe.html
The new guidance doesn’t specifically mention or address the common standards. But as you might recall, all 12 of the RTT winners adopted them. They got points in their applications for doing so (as they did for embracing other reforms the department favors). So now that they’ve won money on those promises, the department wants to make sure that they’re carried out.
Those that wander too far from their key goals will be subject to ‘enforcement actions.’ [The heavy-handed fist of the federal government…]
We who wrote this report (Burke and Garner) have heard that many states are having “buyers’ remorse” on their decision to go along with the Race to the Top scheme.
[Please note — This entire Section was added in this update.]
D. RTTT and Per-Pupil-Spending
As mentioned above, the Education Department conducted the Race to the Top (RTTT) competition in two phases. On 3.29.10, the Department announced that the two “winners” of Phase 1 were Delaware (#1) and Tennessee (#2).
On 8.24.10, the Department announced the ten “winners” for Phase 2. The winning states were ranked from #1 (first place) to #10 (tenth place). The ten winners were: #1 — Massachusetts, #2 — New York, #3 — Hawaii, #4 — Florida, #5 — Rhode Island, #6 — District of Columbia, #6 — Maryland, #8 — Georgia, #9 — North Carolina, #10 — Ohio. (Note that neighbors D.C. and Maryland tied for sixth place, and there was no seventh place.)
The 12 RTTT winners and the Award amounts are shown in the Table, Race to the Top (RTTT) Awards.
The Table also lists the rank for each state in the Phase 1 competition and the Phase 2 competition. You will note that Alaska, North Dakota, Texas, and Vermont did not participate. We commend these states for not playing the game.
We reluctantly entered the word “award” in this Table. The Education Department uses the term “award” to apply to the grant passed to the winning states. On the dates mentioned above, the Department notified each “winning” Governor with an “Award Letter” that specified the dollar amount of the grant.
Of course, federal awards or grants must come from somewhere. We taxpayers pay huge amounts of money in taxes to the federal government, and it returns a small portion back to the states and calls it an “award” or “grant.” This is not free money!
Race to the Top (RTTT) Awards
(Rank, Awards, Award / Student / Year)
| State |
Phase 1 Rank |
Phase 2 Rank |
RTTT Award |
Enrollment (No. Students) |
Award/Stud./ Year |
| Alabama | 37 | 36 | 748,000 | ||
| Alaska | — | — | 129,000 | ||
| Arizona | 40 | 12 | 1,161,000 | ||
| Arkansas | 17 | 21 | 487,000 | ||
| California | 27 | 16 | 6,435,000 | ||
| Colorado | 14 | 17 | 827,000 | ||
| Connecticut | 25 | 25 | 559,000 | ||
| Delaware | 1 | — | $119,122,128 | 125,000 | $238 |
| District of Columbia | 16 | 6 | $74,998,962 | 70,000 | $268 |
| Florida | 4 | 4 | $700,000,000 | 2,771,000 | $63 |
| Georgia | 3 | 8 | $399,952,650 | 1,735,000 | $58 |
| Hawaii | 22 | 3 | $74,934,761 | 174,000 | $108 |
| Idaho | 28 | — | 283,000 | ||
| Illinois | 5 | 15 | 2,117,000 | ||
| Indiana | 23 | — | 1,049,000 | ||
| Iowa | 24 | 22 | 480,000 | ||
| Kansas | 29 | — | 467,000 | ||
| Kentucky | 9 | 19 | 692,000 | ||
| Louisiana | 11 | 13 | 661,000 | ||
| Maine | — | 33 | 185,000 | ||
| Maryland | — | 6 | $249,999,182 | 828,000 | $75 |
| Massachusetts | 13 | 1 | $250,000,000 | 941,000 | $66 |
| Michigan | 21 | 23 | 1,635,000 | ||
| Minnesota | 20 | — | 830,000 | ||
| Mississippi | — | 34 | 496,000 | ||
| Missouri | 33 | 30 | 919,000 | ||
| Montana | — | 35 | 142,000 |
| State |
Phase 1 Rank |
Phase 2 Rank |
RTTT Award |
Enrollment (No. Students) |
Award/Stud./ Year |
| Nebraska | 39 | 31 | 290,000 | ||
| Nevada | — | 24 | 463,000 | ||
| New Hampshire | 38 | 29 | 198,000 | ||
| New Jersey | 18 | 11 | 1,362,000 | ||
| New Mexico | 30 | 28 | 331,000 | ||
| New York | 15 | 2 | $696,646,000 | 2,669,000 | $65 |
| North Carolina | 12 | 9 | $399,465,769 | 1,520,000 | $66 |
| North Dakota | — | — | 92,000 | ||
| Ohio | 10 | 10 | $400,000,000 | 1,802,000 | $55 |
| Oklahoma | 34 | 20 | 649,000 | ||
| Oregon | 35 | — | 565,000 | ||
| Pennsylvania | 7 | 18 | 1,824,000 | ||
| Rhode Island | 8 | 5 | $75,000.000 | 142,000 | $132 |
| South Carolina | 6 | 14 | 706,000 | ||
| South Dakota | 41 | — | 119,000 | ||
| Tennessee | 2 | — | $500,741,220 | 1,006,000 | $124 |
| Texas | — | — | 4,949,000 | ||
| Utah | 19 | 25 | 573,000 | ||
| Vermont | — | — | 89,000 | ||
| Virginia | 31 | — | 1,238,000 | ||
| Washington | — | 32 | 1,026,000 | ||
| West Virginia | 36 | — | 281,000 | ||
| Wisconsin | 26 | 27 | 861,000 | ||
| Wyoming | 32 | — | 87,000 | ||
| Total U.S. | $3,940,861,000 | 49,788,000 | $71 |
Source:
U.S.D.O.E.
2.21.11
http://www2.ed.gov/programs/racetothetop/phase1-applications/score-summary.pdf
http://www2.ed.gov/programs/racetothetop/phase2-applications/summary.pdf
http://www2.ed.gov/programs/racetothetop/phase2-applications/index.html
http://nces.ed.gov/programs/digest/d09/tables/dt09_034.asp?referrer=list
Notes:
1. The latest available USDOE enrollment numbers are “Projected Fall 2009.”
2. Award per student per year is based on the 4-year award period.
3. The Total Award / Student / Year of $71 is based on the total RTTT awards and total students for the 12 RTTT winning states.
For the enrollment numbers in the Table, we used the latest available figures from the USDOE (“Projected Fall 2009”). These numbers include public elementary and secondary schools (K-12) for each state.
The “Award / Student / Year” column needs some explanation. Let’s use Delaware as an example. Delaware placed No. 1 in Phase 1 and received a grant for $119,122,128; the state has 125,000 students in its K-12 public schools. [$119,122,128 divided by 125,000 students = $953 / student] For each state, the award period is four years. [$953 per student divided by 4 years = $238 / student / year] Then the Award per Student per Year = $238.
The Award per Student per Year allows us to keep education spending in perspective. Public school education in this country has always been funded primarily at the local and state levels. The federal funding is relatively minor.
Let’s take Massachusetts as an example. The state received $250 million in federal RTTT. That amount may seem large, but it represents only about 1/144 (0.70 %) of Massachusetts’overall school funding for the four-year period. Most states have similar percentages.
The Texas Education Agency (TEA) is charged with the task of collecting and reporting state education data, much of which has to do with local, state, and federal funding sources. The TEA recently produced the 2009-10 Texas Education Agency Pocket Edition of Texas Public School Statistics (published in December 2010).
According to the TEA’s Pocket Edition, the per-pupil spending figure for Texas is $11,567. This figure includes the total per-pupil spending (i.e., expenditures) including local, state, and federal dollars.
Total Revenue Per Pupil — $9,965
Total Expenditures Per Pupil — $11,567–This figure includes local revenue (47.1%), state (42.9%), and federal revenue (10.0%).
Federal funding is nice when you are getting it, but what happens when the flow stops? States and local governmental agencies got used to the Stimulus funds during 2009 and 2010.
Now that the Stimulus funds are essentially depleted, states and cities are running deficits and are being forced to lay off workers. In the same way, RTTT money is temporary, but the “pain” of Common Core Standards will last for many years to come!
E. States That Adopted Common Core Standards
http://www.corestandards.org/in-the-states
Alaska and Texas early-on declared that they would not participate in the Common Core Standards / Race to the Top. They are to be commended for not going along with the federal takeover of the public schools.
As of 2.23.11, forty-two (42) out of the 51 states (50 states + D.C. = 51 “states”) have formally adopted the Common Core Standards.
The nine (9) states that have not yet adopted the CCSstandards are: Alaska, Maine, Minnesota, Montana, Nebraska, North Dakota, Texas, Virginia, and Washington.
[Please refer to our table, Scorecard of States, to see how each state stands on RTTT, CCS, and Assessment Consortia.]
Can states back out of the national standards if they have a change of heart? As discussed above, the 12 states that accepted federal RTTT funds may be stuck unless they pay the money back to the federal government. However, we have presented in the conclusion of this paper some hopeful ideas that we believe may offer possible solutions.
What about the other 39 states? [51 states – 12 states = 39 states.] On 9.02.10, the U.S. Department of Education awarded funds to two assessment consortia (SBAC and PARCC). The assessment consortia are the ones who will produce the national assessments that students will be required to take. Most of us know that when anyone accepts federal money, there are always strings attached.
We need to stop and explain the differences between the terms “assessments” and “tests.” Tests have right-or-wrong answers, and the majority of test questions are generally scored objectively.
Assessments are subjectively scored based upon evaluators’ cognitive domain (e.g., opinions, feelings, and emotions) and may also utilize artificial intelligence. The types of questions on assessments might include students’ opinions/beliefs/emotions, performance-based projects, simulations, and/or open-ended responses.
As Gewertz explained:
http://blogs.edweek.org/edweek/curriculum/2011/01/guidance_on_rtt_–_httpwwwedwe.html
Only 12 states won Race to the Top money, but 45 states and the District of Columbia are participating in consortia to design new assessments for the common standards. Those consortia have $360 million in federal money to do that work. And a condition of being in the consortia is that you adopt the common standards. So un-adopting them would mean un-participating in the assessment consortia.
[The Department of Education’s updated website (as of 2.23.11) indicates that 44 states plus D.C. are participating in the two consortia. The total money awarded to the two consortia is approximately $330 million.]
A state that drops out of the national standards might be required to repay the federal government. Quite likely, the repayment amount has not been established. If we divide the total award of $330 million by 45 states, we get $7.3 million per state, a rather small amount of money considering how much more the taxpayers in each state will have to pay to implement the entire CCS initiative.
Many states might jump off the national standards train. As Jim Stergios wrote on 11.16.10:
The key states to watch are California, Indiana, Minnesota, *New Jersey, Texas and Virginia. In addition to being states that either did not adopt the national standards, or adopted them and did not win federal funds, they have one additional and important commonality among them: They have had higher standards than most other states in the nation.
*The founders of the New Jersey Coalition for World Class Math
( http://njworldclassmath.webs.com ) strongly disagree with Mr. Stergios’ inclusion of New Jersey in his grouping of states that have higher standards than most other states in the nation. The New Jersey math standards for Grades 9 – 12 underwent minor revisions in 2008; but the Pre-K through Grade 8 New Jersey math standards still reflect the pre-2006, discredited NCTM constructivist math standards and are not aligned with the recommendations of the The National Mathematics Advisory Panel.
Texas Governor Rick Perry, as the new Chairman of the Republican Governors Association, may force the National Governors Association to revisit its support of the national standards. The game is not over.
Scorecard of States:
Participation in — RTTT, CCS, Assessment Consortia
| State |
Abbrev. |
RTTT Winner |
Adopted CCS |
Assessment Consortia PARCC SBAC |
None |
|
| Alabama |
AL |
Y |
Y |
Y |
||
| Alaska |
AK |
N |
||||
| Arizona |
AZ |
Y |
Y |
|||
| Arkansas |
AR |
Y |
Y |
|||
| California |
CA |
Y |
Y |
|||
| Colorado |
CO |
Y |
Y |
Y |
||
| Connecticut |
CT |
Y |
Y |
|||
| Delaware |
DE |
Y |
Y |
Y |
Y |
|
| Florida |
FL |
Y |
Y |
Y |
||
| Georgia |
GA |
Y |
Y |
Y |
||
| Hawaii |
HI |
Y |
Y |
Y |
||
| Idaho |
ID |
Y |
Y |
|||
| Illinois |
IL |
Y |
Y |
|||
| Indiana |
IN |
Y |
Y |
|||
| Iowa |
IA |
Y |
Y |
|||
| Kansas |
KS |
Y |
Y |
|||
| Kentucky |
KY |
Y |
Y |
Y |
||
| Louisiana |
LA |
Y |
Y |
|||
| Maine |
ME |
Y |
||||
| Maryland |
MD |
Y |
Y |
Y |
||
| Massachusetts |
MA |
Y |
Y |
Y |
||
| Michigan |
MI |
Y |
Y |
|||
| Minnesota |
MN |
N |
||||
| Mississippi |
MS |
Y |
Y |
|||
| Missouri |
MO |
Y |
Y |
|||
| Montana |
MT |
Y |
||||
| State |
Abbrev. |
RTTT Winner |
Adopted CCS |
Assessment Consortia PARCC SBAC |
None |
|
| Nebraska |
NE |
N |
||||
| Nevada |
NV |
Y |
Y |
|||
| New Hampshire |
NH |
Y |
Y |
|||
| New Jersey |
NJ |
Y |
Y |
Y |
||
| New Mexico |
NM |
Y |
Y |
|||
| New York |
NY |
Y |
Y |
Y |
||
| North Carolina |
NC |
Y |
Y |
Y |
||
| North Dakota |
ND |
Y |
Y |
|||
| Ohio |
OH |
Y |
Y |
Y |
Y |
|
| Oklahoma |
OK |
Y |
Y |
Y |
||
| Oregon |
OR |
Y |
Y |
|||
| Pennsylvania |
PA |
Y |
Y |
Y |
||
| Rhode Island |
RI |
Y |
Y |
Y |
||
| South Carolina |
SC |
Y |
Y |
Y |
||
| South Dakota |
SD |
Y |
Y |
|||
| Tennessee |
TN |
Y |
Y |
Y |
||
| Texas |
TX |
N |
||||
| Utah |
UT |
Y |
Y |
|||
| Vermont |
VT |
Y |
Y |
|||
| Virginia |
VA |
N |
||||
| Washington |
WA |
Y |
||||
| West Virginia |
WV |
Y |
Y |
|||
| Wisconsin |
WI |
Y |
Y |
|||
| Wyoming |
WY |
Y |
Y |
|||
| Washington, D.C. |
DC |
Y |
Y |
Y |
||
|
Totals |
12 |
42 |
25 |
31 |
5 |
|
Sources:
USDOE, PARCC, SBAC
2.23.11
Note:
Depending on the source, there is a discrepancy in the Consortia list for Georgia, New Hampshire and Wyoming.
http://www.corestandards.org:80/in-the-states
http://www.k12.wa.us/SMARTER/default.aspx
http://www.fldoe.org/parcc/pdf/partstates.pdf
F. Federal Control of Education
Now, as the Obama administration pushes for the nationalization of our public schools, local control is being eviscerated.
Texas Education Commissioner Robert Scott described the push for national education standards as “a step toward a federal takeover of the nation’s public schools.”
On 7.28.10, Donna Garner wrote:
I am appalled that the public has not yet figured out that this federal takeover of the public schools is as bad if not worse than the federal takeover of the healthcare system.
Our children are our most important products. How can people stand back and hand their children’s minds over to the federal government to indoctrinate them?
Remember that the Common Core Standards at this point are only for Math and English, but coming on their heels will be Science and Social Studies. Can you imagine what the standards/curriculum/assessments produced by the Obama administration would look like for Science and Social Studies?
Ben Boychuk tells us about the “voluntary” nature of the standards.
The standards are billed as ‘voluntary,’ but that’s a joke. The Obama administration has already announced plans to make $14 billion in federal Title I funds and another $15 billion in future Race to the Top grants contingent on states adopting the national standards. In short, the standards would be as ‘voluntary’ as reporting personal income to the IRS, regulating the drinking age or maintaining the speed limit. Just try to opt out and see what happens.
Obama and Arne Duncan employed a classic “bait-and-switch” strategy to take over the schools. In 2009, most of the governors (except for Texas and Alaska) signed the Common Core standards adoption agreements before the public was told about the national tests.
Duncan waited until the state contracts were signed before he made the rest of the plan clear: States would have to adopt the national standards in order to qualify for Race to the Top funds. Other “surprises” included national assessments, national curriculum, and an elaborate national tracking system to link student assessment scores to individual teachers.
Up until early February 2010, the states that signed the agreements thought they only had to commit to teach 85 % of the Common Core standards. They assumed that the other 15 % would give them some “local control.”
During a two-day meeting in February (2.1.10), they were told by a deputy executive director of the Council of Chief State School Officers that states will not be allowed to pick and choose; they must use the entire national standards document word for word (i.e., 100 %).
[Even if states are allowed their own 15 %, students are going to be assessed on the CCS’s 85%. Consequently, teachers will be forced to teach the 85 % material in order for the students to get a passing assessment score.]
G. Quality of Common Core Standards
How good are the CCS? What are the experts saying about the national standards (Common Core Standards)? Many who are knowledgeable in the field keep trying to remind the public that the national standards are untested and unproven with no student data to support them.
Both Massachusetts and California chose to drop their very good standards in order to adopt the national standards.
Catherine Gewertz made these comments about reversing the Massachusetts decision on 1.31.11:
At the behest of a local school board, three lawmakers in Massachusetts have drafted a bill that would override the state board of education’s decision to adopt new common academic standards.
…Mr. Cooke said he believes that in adopting the standards [Common Core Standards/Race to the Top], the state board was motivated more by the prospect of winning the federal Race to the Top contest—which awarded points to states that adopted the standards—than by what is best for students. And Mr.Cooke worries that embracing the standards will mean loss of local control over curriculum.
In an earlier article, people in Massachusetts voiced their concerns about adopting the national standards in Massachusetts (1.17.11):
http://www.telegram.com/article/20110117/NEWS/101170409
My concerns remain, one, we’re dumbing down state standards; two, the increased costs on schools because we would have to have a new curriculum, a new testing; and, the third, you’re letting a bunch of faceless federal bureaucrats technically set the standards for all the schools in Massachusetts…
I don’t think it’s in the best interests of the students at Tantasqua or even the Commonwealth of Massachusetts (to adopt the National Educational Standards). Massachusetts students fare better on classic achievement tests than students from any other state, so why would we want to go backward?
CCRS consist wholly of content-empty and culture-free generic skills (e.g., ‘Analyze how and why individuals, events, and ideas develop and interact over the course of a text’).
Dr. Stotsky has gone on to say that the CCS emphasize informational texts instead of the classics. The CCS are also full of educational gibberish such as “use modal auxiliaries to convey various conditions” instead of saying, “identify subject and verb agreement in a sentence.”
An English teacher put it best when she wrote on the Blue Mass Group blog (Boston Herald, 9.29.10):
I teach English because I love literature of all genres – drama, fiction and poetry – and I love to teach kids how to think and write critically through the close reading and study of literature. The study of literature is the study of the human condition. No other classroom offers that. Sadly adoption of the Common Core State Standards all but ensures that the classroom experience I just described is a thing of the past.
Dr. R. James Milgram and Dr. Sandra Stotsky issued a report on the national standards for math and English. The title best captures their overall sentiments: “Fair to Middling: A National Standards Progress Report.” Stotsky determined that the elements were too broadly worded, and explicit goals were not established. Also literature was very weak.
Educators are displeased with many aspects of the national standards. Examples include: the standards have dropped cursive writing, English grammar and reading are weak, and grade-by-grade progression is poorin both English and math.
The national standards in math were found to be weaker than some of the state standards (California, Indiana, Massachusetts, and Minnesota). That is quite unfortunate because STEM (Science, Technology, Engineering, and Mathematics) Education is especially important in this technological age. Also the math standards specified an “unteachable” number of topics (70 in one year).
The Texas State Board of Education (SBOE) adopted excellent standards documents during the last three years for English / Language Arts / Reading (ELAR), Science, and Social Studies. Many experts deem these three standards documents to be the best in the country. How do the Common Core Standards compare with the Texas Standards?
A Comparison of CCS-ELAR Standards to Texas-ELAR Standards
Please notice the stilted and confusing verbiage used in the Common Core Standards for ELAR compared to the clarity of the terms used in the Texas ELAR standards. If you were a teacher, which set of standards would be easier for you to understand and implement into your classroom? If the standards are clearly worded, the chances of their being implemented with fidelity by the teachers into their classrooms are greatly increased.
The Common Core Standards (CCS) for English Language Arts & Literacy in History/Social Studies, Science, and Technical Subjects K–12 were published on June 2, 2010. Here is the link:
http://www.corestandards.org/assets/CCSSI_ELA%20Standards.pdf
The Common Core Standards for ELAR are organized into the following five strands:
Reading
Writing
Speaking
Listening
Language
===================
The new Texas English / Language Arts / Reading (ELAR) standards were adopted in May 2008 and are organized into the following five strands.
Reading (literary and informational texts)
Writing
Research
Listening and Speaking
Oral and Written Conventions
Please notice that Texas has a separate section (Oral and Written Conventions) that emphasizes the all-important writing skills of grammar, usage, spelling, capitalization, punctuation, and handwriting (including both printing and cursive).
The Texas standards lay out the important skills emergent readers need to learn to be successful readers — systematically taught phonemic awareness and decoding (phonics) skills. Sadly, the way the Common Core Standards are written would allow almost any whole-language reading program to satisfy them; and whole language instruction has been completely discredited by the empirical reading research done by the National Institutes of Health (NIH).
The Texas standards also have a well-developed strand dedicated solely to research writing.
Both literary and informational text are given equal treatment in the Texas ELAR’s. In the CCS-ELAR’s, the emphasis is definitely taken off classic literature and is focused heavily on informational text.
Here are the links to the Texas ELAR standards:
English / Language Arts / Reading – K – Grade 5
http://ritter.tea.state.tx.us/rules/tac/chapter110/index.html
English / Language Arts / Reading — Grades 6 – 8
http://ritter.tea.state.tx.us/rules/tac/chapter110/ch110b.html#110.17
English / Language Arts / Reading — Grades 9 – 12
http://ritter.tea.state.tx.us/rules/tac/chapter110/ch110c.html#110.30
For states which are genuinely interested in writing their own standards, the Texas Education Agency (TEA) has said they will be glad to collaborate to help guide states through the process of developing their own standards. The TEA believes the standards for each state should be unique, but the TEA will be glad to walk other states’ staffers through the Texas standards.
H. Assessments
Donna Garner has been warning people for years about the federal takeover of our schools. She provided the following information about the key role of assessments in this takeover scheme. She believes it is easy to tell that assessments are important because the U. S. Department of Education has awarded $330 million for these national assessments to be developed.
Mrs. Garner has predicted for well over two years that a state must commit to “Value-Added Assessments” (VAA) in order to qualify for the RTTT Award. [VAA is a method of tying an individual student’s test scores to his individual teacher to measure progress the student has made under that teacher.] It looks as if she was right. VAA is the key to forcing teachers to teach whatever it is that the federal government wants them to teach.
Garner has been using this graphic for about two years to illustrate the inter-relationship of the various parts. This is the way that the Common Core Standards and Race to the Top work. [The arrows mean “lead to.”]
National standards → national assessments → national curriculum → teachers’ salaries tied to students’ test scores → teachers teaching to the test each and every day → national indoctrination of our public school children → national database of students and teachers
How can the Obama administration take over the control of our nation’s public schools and impact the entire future of our nation?
It is easy. All his administration has to do is to pressure teachers to teach each and every day whatever is on the national assessments that are tied to the national curriculum that is tied to the national standards.
Then by making sure that individual students’ scores are tied directly to their individual teachers and that those teachers’ performance scores are made public, the Obama administration will have achieved its goal of forcing teachers to indoctrinate their public school students. The indoctrination will promote such things as: subjective feelings, opinions, beliefs, multiculturalism, political correctness, diversity, global warming, homosexuality, and social justice.
Consider the problems associated with subjective assessments rather than with objective tests that contain right-or-wrong answers. With objective tests, the end score is much more accurate for comparing state-to-state, school-to-school, and student-to-student results.
With subjective questions scored by following a rubric, the students are scored based upon the subjective opinions of the evaluator; and opinions differ from person to person.
Worse yet, to whom will the parent go to complain if he feels his child’s national assessments have been graded wrong…to the U. S. Department of Education in the insular world of Washington, D. C.?
Not only are subjective assessments open to indecisiveness, but they are also much more expensive to score. Are taxpayers going to want to pay higher taxes just so their students’ assessments can be scored in a subjective way?
Just think about what states will have to do to implement the CCS into their schools and how much all of this is going to cost in time and salaries:
1. Provide digitized CCS master copies of documents to all educators
2. Pay the salaries of consultants to come into the state and into school districts to “interpret” to educators what the gobbledygook CCS jargon means. Produce grade-level-specific curriculum documents that break down the broad and generic CCS requirements into explicit goals for teachers/students to reach at each grade level
3. Train teachers at each grade level to understand fully what needs to be taught and help them to develop all new lesson plans accordingly
4. Do intense teacher training to acquaint them fully with the national assessments tied to the CCS
5. Create an entirely new teacher evaluation system that is tied to how well teachers’ students do on the national assessments
6. Coordinate the K-12 curriculum documents and assessments with college admission and higher-education standards
7. Aggregate immense amounts of data in a standardized format to transmit to the national database
Federally Controlled Assessments for All CCS States
The following information was taken from Education Week, 6.23.10: http://www.edweek.org/ew/articles/2010/06/23/36assessment.h29.html?tkn=MUTFAu%2FYouCRzguLFMOG9pu3XKtubM04BYIa&print=1
Consortia (1)
On 9.2.10, the U. S. Department of Education awarded $160 Million to the SMARTER Balanced Assessment Consortium (SBAC) to develop assessments tied to the Common Core Standards for 31 states including: Alabama, Colorado, Connecticut, Delaware, Georgia, Hawaii, Iowa, Idaho, Kansas, Kentucky, Maine, Michigan, Missouri, Montana, North Carolina, North Dakota, New Hampshire, New Jersey, New Mexico, Nevada, Ohio, Oklahoma, Oregon, Pennsylvania, South Carolina, South Dakota, Utah, Vermont, Washington, Wisconsin, and West Virginia.
SMARTER will rely heavily upon subjectively scored assessments such as open-ended responses, projects, teacher-scored benchmarks, etc. The term “subjectively scored assessments” means students’ scores are based upon evaluators’ cognitive domain (e.g., opinions, feelings, and emotions).
SMARTER will use computer-adaptive technology that will adjust the difficulty of test questions in relation to how well the student does on each response.
SMARTER will have teachers score the subjectively scored projects and open-ended questions supplemented with computer-scoring (i.e., artificial intelligence) software.
SMARTER will use one test at the end of the year for accountability purposes but will create a series of interim tests (a.k.a., benchmarks) to let students, parents, and teachers know whether the students are on track.
Consortia (2)
On 9.2.10, the U. S. Dept. of Education awarded $170 Million to Partnership for Assessment of Readiness for College and Careers (PARCC, or Partnership) to develop assessments linked to the Common Core Standards for 26 states. These states are a part of PARCC: Alabama, Arkansas, Arizona, California, Colorado, the District of Columbia, Delaware, Florida, Georgia, Illinois, Indiana, Kentucky, Louisiana, Massachusetts, Maryland, Mississippi, North Dakota, New Hampshire, New Jersey, New York, Ohio, Oklahoma, Pennsylvania, Rhode Island, South Carolina, and Tennessee.
The PARCC coalition will test students’ ability to read complex text, complete research projects, excel at classroom speaking and listening assignments, and work with digital media.
PARCC will replace the one end-of-year high stakes accountability test with a series of assessments administered throughout the year.
PARCC emphasizes college and career success with less emphasis on formative assessments but would use both human and computer scoring.
Testing experts have voiced their concerns (a) about the lack of research-based evidence for both the assessment plans and (b) the rush to get the national assessments in place by 2014-15.
To learn more about the national assessments to be developed by the SMARTER and PARCC consortia, please go to the following link:
The national assessments are to be done online and will cost taxpayers unbelievable amounts of money to purchase the very latest multimedia technology for all students (Bill Gates wins). With tight budgets, where will school districts find the money to pay for all of this expensive equipment and software?
Layers of technology staffers will be required to keep the technology functioning in every classroom because students will be taking frequent national formative (benchmark or periodic assessments) and summative assessments (end-of-course assessments) that will take weeks to finish because they will contain performance-based simulations, interactions, digital media, graphing, etc.
The computer labs scattered around most schools will not suffice because the large numbers of students who will be involved with taking the national summative and formative assessments regularly will necessitate multimedia technology for each student.
Taxpayers will be required to pay for elaborate and ongoing teacher training and evaluations on all the new and innovative multimedia technology required for the online national assessments.
On 9.16.10, Houghton Mifflin announced it is putting $400 Million into investing in more technology for our nation’s classrooms. Houghton is also planning to invest $300 Million during the next three years to produce an algebra application for the Apple iPod that contains the full curriculum and online tutoring based on quiz and test scores.
Where are the taxpayers in the downturn of our economy going to get the funds to pay for all ofthese new and expensive “techie toys”?
I. Follow the Money Trail
1. Marc Tucker and America’s Choice
On August 3, 2010, Pearson (the largest education publishing company in the world) purchased Marc Tucker’s America’s Choice for $3.6 Million per year to be paid as an endowment to Tucker’s National Center on Education and the Economy (NCEE).
Phil Daro, the head of the Common Core Math Writing Team, is on the board of America’s Choice.
In an article on Oct. 26, 2010, Charles Chieppo, a senior fellow, and Jamie Gass, director of the Center for School Reform at Pioneer Institute, stated that a key finding of the 2008 National Math Advisory Panel is that more students need to be prepared to take Algebra I in 8th grade. However the CCS math requirements are “dumbed down” and will only serve to weaken students’ math and science knowledge.
R. James Milgram, math professor emeritus at Stanford University, concurs and said the Common Core math standards are several years behind the standards in high-performing countries; and the “coherence of the standards for fractions” offers serious concerns.
According to a report entitled “Literary Study in Grades 9, 10, and 11in Arkansas” (pp 41-42), America’s Choice (AC) was brought into Arkansas in 2006 at a cost of $6.2 Million to turn around the low-performing schools on its School Improvement list. Was AC successful in doing that? No.
Arkansas high-school English teachers in an AC school testified that AC “homogenizes” all students to fit the lowest standards and holds the better students back. The Pre-AP students do the same AC assignments as the lower-level students.
AC expects students to read 25 books per year but excludes the difficult classics right away…the AP Syllabus supersedes AC…AC pedagogy is more important than content…AC courses are designed specifically for kids reading at the 5th or 6th gradelevel in an attempt to get them reading at grade level…we‘ve changed from book-based, theme-based, literature-based to strategy-based. The emphasis of AC is not on college-readiness but is on how to fill out forms, on life skills, on reading instructional manuals, and gets rid of the classics.
Arkansas is not the only state that has complained about the lack of academic achievement by AC schools. Massachusetts had the same outcome when AC partnered with Holyoke, Massachusetts, from 2006-2008. “As noted by a local reporter: ‘Few improvements were seen when the schools tried the America’s Choice math program so that was ended.’ ”
For more information about who and what Marc Tucker is, please read Donna Garner’s 11.29.10 article on EducationNews.org.
http://www.educationnews.org/index.php?news=103613
2. Bill and Melinda Gates Foundation
What part has the Bill and Melinda Gates Foundation played in the federal takeover of the public schools under the Obama administration? Since the beginning of Obama’s campaign for President, Bill Gates has supported him and the Obama agenda. Because Massachusetts has had some of the highest standards in the country, the goal was to get the “crown jewel” of standards to join CCS, and that would influence other states to join Obama and the Gates Foundation’s national standards movement.
In 2008, the Gates Foundation awarded $35 Million to the Council of Chief State School Officers (CCSSO) and the National Governors Association (NGA) to write and promote the CCS.
Achieve, Inc. received $12.6 Million from the Gates Foundation in 2.08. Massachusetts Governor Deval Patrick is a board member for Achieve, Inc…
It was Achieve, Inc. (and the Council of Chief StateSchool Officers) that paid for Massachusetts Education Commissioner Milton Chester’s frequentfirst-class travel and luxury resort expenses to such places as Arizona, Chicago, Washington, D. C., and London.
[Is it any wonder that Massachusetts Gov. Patrick and Ed. Commissioner Chester were so committed to dump their state’s first-class standards and replace them with CCS/RTTT?]
The Fordham Institute, who gave favorable reviews to the CCS, received $1.4 Million from the Gates Foundation including $960,000 to review the Common Core Standards.
On December 10, 2010, the roll-out of the national database was announced by the United States Department of Education; and the consortia efforts were supported by the Gates Foundation and the Susan Dell Foundation. These are both companies that will stand to make billions of dollars from the CCS/RTTT digitized standards, curricula, assessments, teacher evaluations, and personal data on all students (and their families) and educators in the public schools of our country.
J. Congressional Hearings on Common Core Standards
So far as we know, the only hearing that was ever held on Common Core Standards/Race to the Top occurred on 12.08.09. Congress never took a floor vote on this huge expansion of the federal government into public education.
The goal of the initiative is to provide a voluntary, research and evidence-based set of standards for mathematics and English-language arts.
I want to emphasize the word ‘voluntary’ in that description. While the Common Core is still under development, I don’t believe anyone involved in the initiative intended for it to become the one and only set of academic standards in the United States.
For that reason, I’d like to focus my remarks this morning not on the quality of the standards themselves, but on what the federal government is doing with those standards.
Secretary Duncan has not been shy about his intentions to dramatically reshape education through the Race to the Top fund.
And one key component of the Race to the Top guidelines is
the requirement that states participate in and adopt a set of common academic standards.
The only common, multi-state academic standards I am aware of are those being developed through the Common Core Initiative. Therefore, it stands to reason that any state wishing to receive funding through the Race to the Top program will be mandated to adopt the Common Core– and to test its students based on those standards.
In other words, the Common Core is being transformed from a voluntary, state-based initiative to a set of federal academic standards with corresponding federal tests.
To our knowledge, no other Congressional hearings, even with invited testifiers, have taken place since 12.08.09.
K. Legality of CCS and RTTT
What constitutional authority does the Federal government have in education? As the report makes clear, pretty much none. Under the 14th Amendment, Washington must prohibit state and local discrimination in the provision of education, and the feds have authority over the District of Columbia and other federal lands. Other than that, the feds have no constitutional authority whatsoever to be involved in education.
Currently, the United States does not have a national school system. In accordance with the 10th Amendment of the U.S. Constitution, the ultimate authority to create and administer education rests with the states.
The $4.35 billion Race to the Top (RTTT) competition was created under the Stimulus Bill (American Recovery and Reinvestment Act, or ARRA).
Is Secretary Arne Duncan violating U.S. Education Code?
20 U.S.C. § 3403 (Pub.L. 96-88, Title I, § 103, Oct. 17, 1979, 93 Stat. 670). United States Code. Title 20. Education. Chapter 48states:
It is the intention of the Congress in the establishment of the Department to protect the rights of State and local governments and public and private educational institutions…The establishment of the Department of Education shall not increase the authority of the Federal Government over education…
No provision of a program administered by the Secretary or by any other officer of the Department shall be construed to authorize the Secretary or any such officer to exercise any direction, supervision, or control over the curriculum, program of instruction, administration…
Race to the Top as written is not in compliance with the U.S. Code. The American Recovery and Reinvestment Act of 2009 (ARRA) had no provisions that allowed Sec. Duncan to create a program in which state and school districts are bribed to comply with his direction.
Read the legislation: the ARRA hardly gives Duncan the power and control he has seized through Race to the Top…The ARRA does not allow his RTTT bastardization of the original education legislation as RTTT violates Federal Code.
Let’s consider a state which chooses to drop out of CCS and/or RTTT. Could the Education Department penalize such a state by stopping the flow of Title I money?
Title I funding goes directly to the school districts from USDOE. Obama and Duncan may try to get even with those states by passing new ESEA regulations to remove U.S. Code, Title 20, Section 3403 provisions. (See Code above.) Congress and the states must remain diligent. [Note: The above statement comes from high-level state education department officials.]
CONCLUSION
A. Common Core States
The following statements are directed to the 42 states that have formally adopted the Common Core Standards. These states should drop the national standards for the following reasons:
1. For states that did not receive RTTT funding, it will cost them millions of dollars to switch to the national standards. In California, which did not win RTTT funds, it would cost them between $1 billion and $2 billion to convert to the Common Core Standards! Other states will face the same type of expenditures far-and-above the federal dollars to implement the CCS.
2. The national standards allow the federal government to take over the schools.
3. No studies show that national standards will improve student achievement. The research does not exist.
4. The quality of the national standards is very questionable. The Common Core Standards are weaker than the standards of many states.
5. The proposed national standards are vague and lack the academic rigor of the standards in Massachusetts, California, Texas, and a number of other states.
6. Massachusetts and California dropped their very good standards in favor of the inferior proposed national standards, an action many people in those states are now regretting.
7. With the national standards, the federal government will have a huge influence over the curriculum and governance of our nation’s schools.
8. Through assessments, the federal government will be granted enormous power over our public school students and their future progress. The government can indoctrinate our public school children in whatever direction it chooses (e.g., subjective feelings, opinions, beliefs, victimization, multiculturalism, political correctness, diversity, global warming, homosexuality, and social justice).
9. Because there will be great emphasis on test (assessment) scores, teachers will “teach to the test,” each and every day.
10. The national curriculum will be stressed. Assessment scores will pressure teachers to tailor their instruction to whatever is on the national assessments.
11. Subjective assessments give the assessment writers and scorers unlimited control. Also subjective assessments are more expensive to score than objective tests. Assessment scores cannot be compared from school-to-school and state-to-state because of inherent subjective irregularities.
12. The two assessment consortia received federal money to do that work. When a state leaves the CCS program, the federal government might require the state to repay a portion of the funds. (A total of 45 states participated in the consortia. Maine and North Dakota participated but have not adopted the CCS.)
13. It is possible that the federal government would threaten to withhold Federal Title I funds if a state drops out of the national standards; however, it is doubtful that the Obama administration would want to appear draconian, particularly toward states that dropped out of CCS because of significant budgetary constraints.
14. The legality of the Common Core Standards is on shaky grounds. The federal government has no Constitutional authority whatsoever to control what is taught in local classrooms.
15. If no federal money has yet been sent to a state to implement CCS, then that state should be free to express “buyers’ remorse” and to opt out of CCS.
B. RTTT Winner States
These statements are directed at the 12 states that “won” Race to the Top money. These states also should consider pulling out of RTTT for the following reasons:
1. Race to the Top provides relatively small funding for the schools. Massachusetts, which received a $250 million RTTT grant over four years, found that it amounted to $64 per student/per year (i.e., 44 cents a day per student over four years).
2. When the Texas Education Agency figured out how much the state would have received from Race to the Top, it amounted to a paltry one-time grant of around $75 per student.
3. It will cost millions of dollars for a state to convert from its existing standards to the national standards. For example, it is estimated that California would need to spend around $2 billion to make the conversion.
4. RTTT is an unfunded federal mandate and will cost the states more dollars to implement the Common Core Standards Initiative than they receive.
5. These 12 RTTT states have yielded control over their schools to the federal government.
6. As part of the lengthy application process for RTTT, the states had to standardize their data collection to fit the requirements of the federal government. The USDOE has reams of data on each state, preparing the way for a national database. The fear of many people is that outside entities could gain access to this national database to data mine vital and intrusive information about students, families, and educators.
7. Because the Obama administration cannot afford to fail with the RTTT plan, the U. S. DOE is busily micromanaging everything in the RTTT states. Many states are having “buyers’ remorse” over their decision to participate in the RTTT scheme.
8. The worst case scenario might be that states would have to repay the government over time for the RTTT funds received, but that would be a big public relations nightmare for the DOE to sue states for the return of that money. More than likely, the RTTT money has already been spent by the state and its school districts; and to give back the federal money right away would cause serious hardships on states that are already struggling with their finances. Besides if such a lawsuit were filed, it would take many years for the case to wind through the various courts.
9. The Obama administration has indeed made threats to withhold Title I funding from states that do not participate in the CCS. On 2.22.10, The White House issued this statement:
Require all states to adopt and certify that they have college-and career-ready standards in reading and mathematics, which may include common standards developed by a state-led consortium, as a condition of qualifying for Title I funding.
10. However, with so much to lose in going along with the federal takeover of the public schools, the RTTT states should all get together as a group and announce to the U. S. DOE that they are all withdrawing from the CCS/RTTT Initiative. The U. S. DOE would probably not dare target one state unfairly and would have a very hard time targeting all of the 12 RTTT states as a block.
OUR PLEA
A federal judge has ruled that ObamaCare is unconstitutional because of the over-reaching of the federal government into people’s personal lives. The federal takeover of the public schools by the Obama administration is no less egregious. What is more precious than the minds of our children?
Common Core Standards / Race to the Top never came before Congress for public hearings, debate, and a floor vote; and that is the reason the Obama administration has been able to capture the public schools of our country without the public’s knowledge.
The Common Core Standards and Race to the Top are against public law. ( Please see 20 U.S.C. § 3403(Pub.L. 96-88, Title I, § 103, Oct. 17, 1979, 93 Stat. 670). United States Code. Title 20. Education. Chapter 48 posted below.)
The federal government is forbidden by public law to take over state and local school education systems. The federal government is forbidden by public law to meddle in curriculum and programs of instruction used at the local school level. CCS/RTTT does all of the above.
We are pleading with grassroots citizens to get informed and make their voices heard at the local, state, and national levels in the same way that they did on ObamaCare and at the polls on Nov. 2, 2010. If enough people join together to tell the federal government to stop trying to indoctrinate our children, we can stop the CCS/RTTT tentacles from spreading.
ACTION STEPS
1. Understand the legality of the federal government’s takeover of our schools. Ask your State Attorney General to examine the legality of the government’s position. Please write to your Congressmen, remind them of United States Code. Title 20. Education. Chapter 48, and ask them to repeal CCS / RTTT based upon this public law.
Here is the U. S. Code found in the U. S. Department of Education,
Public Law that limits the authority of the federal government over states’ rights and also prohibits the federal government from exercising any direction, supervision, or control over the curriculum and program of instruction in the public schools.
Department of Education, Public Law — 2/01/10
20 U.S.C. § 3403 (Pub. L. 96-88, Title I, § 103, Oct. 17, 1979, 93 Stat. 670). United States Code. Title 20. Education. Chapter 48
Chapter 48 — Sec. 3403. Relationship with States
-STATUTE-
(a) Rights of local governments and educational institutions
It is the intention of the Congress in the establishment of the Department to protect the rights of State and local governments and public and private educational institutions in the areas of educational policies and administration of programs and to strengthen and improve the control of such governments and institutions over their own educational programs and policies.
The establishment of the Department of Education shall not increase the authority of the Federal Government over education or diminish the responsibility for education which is reserved to the States and the local school systems and other instrumentalities of the States.
(b) Curriculum, administration, and personnel; library resources
No provision of a program administered by the Secretary or by any other officer of the Department shall be construed to authorize the Secretary or any such officer to exercise any direction, supervision, or control over the curriculum, program of instruction, administration, or personnel of any educational institution, school, or school system, over any accrediting agency or association, or over the selection or content of library resources, textbooks, or other instructional materials by any educational institution or school system, except to the extent authorized by law.
2. Urge your State Attorney General and the Congressional Oversight Committees to investigate the legality of the government’s possible withholding of Title I funds.3. Ask your Congressmen to stop the funding for CCS/RTTT.4. Get your Congressmen to pass a bill that contains a hold harmless” clause whereby states would not have to pay back the CCS/RTTT funds already received.
5. Contact your state and locally elected officials; explain to them that they must not apply for any more CCS/RTTT funds.
6. Ask your state department of education officials to remove themselves from any and all assessment consortia (e.g., SMARTER and PARCC).
7. Contact your elected state officials and ask them not to adopt the Common Core Standards (national standards). This would include members of the State Board of Education, legislators on the Education Committee, and your Senators and Congressmen.
8. If your state has formally adopted the national standards, urge them to drop those standards.
9. If your state is an RTTT winner, urge your state education department officials to consider the astronomical costs to state taxpayers over and above the money the state will receive to implement the CSS.
10. Urge your state education officials to write their own standards.
Tell your officials that the Texas Education Agency has offered to collaborate with any state that needs help in setting up a standards adoption process.
11. Share this report with as many people as you possibly can so
there is a groundswell of grassroots objections to CCS/RTTT.
12. Do not give up hope. Bad laws can be repealed and defunded.
Think about ObamaCare. On 1.19.11, the House of Representatives voted 245-189 to repeal ObamaCare. Note that last year the healthcare bill passed the House with only 219 votes. Senate Republicans are pushing to force a vote on the healthcare repeal measure.
13. The Obama administration had a bad day in court on 1.31.11.
Federal Judge Roger Vinson (Florida) ruled that the healthcare law (ObamaCare) was unconstitutional. In his decision, he declared that the individual mandate was unconstitutional and struck down the entire law. In doing so, the judge sided with 26 states [there is power in numbers] that sued to block the healthcare overhaul. Obviously, the administration will appeal the ruling; and the case will work its way up to the Supreme Court.
It is not too late to get off the national standards train. Once the states have spent millions of dollars to convert to the national standards, they will not be very receptive to dropping them. The time to stop the train is now before it picks up speed. You can make a difference! Our country’s educational future is at stake!
Bio for Henry W. Burke
Henry Burke is a Civil Engineer with a B.S.C.E. and M.S.C.E. He has been a Registered Professional Engineer (P.E.) for 37 years and has worked as a Civil Engineer in construction for over 40 years. Burke was a Sanitary Engineer in the National Air Pollution Control Administration for two years. Mr. Burke had a successful 27-year career with a large construction contractor, where he was a Project Engineer, Engineer-Estimator, Superintendent, Senior Engineer, and Training Manager.
He serves as a full-time volunteer to oversee various construction projects for his church and a local Christian university. That university recognized his contributions when it awarded him an honorary doctorate degree.
Henry Burke has written articles on education, engineering, construction, and our economy.
Bio for Donna G. Garner
Donna Garner was an educator for 33 years and was appointed by President Reagan and re-appointed by President George H. Bush to serve on the National Commission on Migrant Education.
Garner has been active in helping Texas develop new English / Language Arts / Reading standards and was a writer/researcher for Scott & White Hospital’s Worth the Wait abstinence education program. She was also the writer/consultant for MyStudyHall.com, an online tutorial to help students (ages 10 through 100) to learn English skills.
Garner is currently a researcher/author and is involved in political, social, and education issues.
12.20.08
“Research: Laptops Do Not Increase Academic Achievement in Reading and Writing”
By Donna Garner
With the Texas Legislature almost ready to begin its 81st Regular Session in January 2009, I am sure the technology lobbyists are out in full force. For years, they have been trying to pressure Legislators to pass legislation that would force taxpayers to fund laptops for every student in the Texas public schools. The question is:Do laptops on every student’s desk raise academic achievement?
In January 2008 a report entitled Evaluation of the Texas Technology Immersion Pilot: Outcomes for the Third Year (2006-07) was released. Based upon four years of solid research, here is the answer to the academic achievement question: “There were no statistically significant effects of immersion on the TAKS reading and Writing.”[TAKS — Texas Assessment of Knowledge and Skills were the tests used to measure academic achievement for TIP.]It seems that laptops on every desk did not raise student academic achievement in the most important foundational skills a student will ever learn — reading and writing.
With the downturn in the economy across our nation, it is more important than ever to make sure that our tax dollars are well spent.I hope that Texas Legislators will read the following information about the Texas Technology Immersion Pilot (TIP) and make responsible decisions based upon this scientific research.
BACKGROUND ON THE TEXAS TECHNOLOGY IMMERSION PILOT (TIP)
The Technology Immersion Pilot was created by the Texas Legislature in 2003. Senate Bill 396 called for the Texas Education Agency (TEA) to establish a pilot project to “immerse” schools in wireless laptops. The mandate came without any funding; but through a competitive grant process, the TEA used more than $20 million in federal monies to fund the TIP project. Concurrently, a federal research study has been evaluating whether student achievement improves over time through this immersion in laptops.The Texas Center for Educational Research is a non-profit research organization in Austin that has been working with the TEA for four years (2004-2008) to produce research-based results.
*Since January 2008, two more reports (July 2008 and December 2008) have been produced that emphasize other aspects of laptop immersion; but neither focuses on the lack of academic achievement on TAKS reading and writing.(Please see links posted at the bottom of this article.)
My concern is that the capstone report (December 2008 — Progress Report on the Long-Range Plan for Technology, 2006-2020) that has been produced for the 81st Legislature really seems to “dance around” the most important issue which is the academic achievement.Instead the report puts out information on issues of secondary importance (e.g., whether students and teachers like laptops, whether the immersion has been deep enough, whether students’ computer skills have improved, whether discipline problems have decreased, whether teachers have received enough technology training, etc.).These may be interesting to study in and of themselves but do not really get to the heart of the matter which is whether laptops indeed improve students’ reading and writing skills appreciably – enough to justify the huge expenditure to provide individual student laptops for all students in Texas.Legislators may be prone to read only the December 2008 TIP report and disregard the January 2008 TIP report that holds the real “meat” of the issue.
Evaluation of the Texas Technology Immersion Pilot: Outcomes for the Third Year (2006-07), January 2008
Following are excerpts taken from this report:
Methodology, p. i: “The overarching purpose of the study is to scientifically investigate the effectiveness of technology immersion in increasing middle school [Grades 6 – 8] students’ achievement in core academic subjects as measured by the Texas Assessment of Knowledge and Skills (TAKS).”
Setting, p. ii: “The research includes 42 grades 6 to 8 middle schools drawn from rural, suburban, and urban locations in Texas…The study focused on three student cohorts in the third year. Cohort 1 included eighth graders (2,586 treatment, 2,863 control) who completed their third project year, Cohort 2 included seventh graders (2,644 treatment, 2,882 control) who finished their second project year, and Cohort 3 included sixth graders (2,597 treatment, 2,840 control) who concluded their first project year. Students in the cohorts were predominantly minority (65%) and economically disadvantaged (67%). In the third year, a total of 1,253 teachers participated in the study, including 591 in immersion schools and 662 in control schools.”
Excerpt from p. iv: “After controlling for student and school poverty, there were no statistically significant effects of immersion on the TAKS reading growth rates for either Cohort 1 (eighth graders) or Cohort 2 (seventh graders)…For Cohort 3 sixth graders, after controls for students’ prior achievement, demographic characteristics, and school poverty, there was no statistically significant effect of immersion on students’ 2007 TAKS reading scores.”
Excerpt from p. vii: “Writing. For both Cohorts 1 and 2, after controlling for pretest writing scores (4th grade writing), demographic characteristics, and school poverty, there was no statistically significant effect of immersion on students’ TAKS writing scores as seventh graders. The immersion effect was negative across both cohorts.”If I am interpreting this data right, it means that immersed students’ TAKS scores actually went down. In other words, their TAKS writing scores decreased when students used laptops extensively.This is a very dismal finding because proponents of laptops have sold the public on the idea that students will improve their writing if they only have their own laptops.
Excerpt from page 16: “…Cohorts 1, 2, and 3 students…complete TAKS reading and mathematics assessments annually, so all student cohorts have pretest and posttest measures…Cohort 2 students completed the TAKS writing assessment in 2004 (4th grade) and 2007 (7th grade).”
Excerpt from Page 68-69: “After controlling for student and school levels of poverty, results show there was no statistically significant effect of immersion on Cohort 1 students’ growth rate for TAKS reading.
Excerpt from Page 69: “TAKS reading outcomes for Cohort 2, similarly, showed no statistically significant effect of immersion on seventh graders’ reading achievement.”
Excerpt from Page 71: Cohort 3, Sixth Grade — “TAKS reading outcomes for sixth graders reported in Table 6.6 show that after controlling for students’ prior reading achievement, demographic characteristics, and the level of school poverty, there were no statistically significant differences in the 2007 TAKS reading T scores for students in immersion and control schools.”
Excerpts from Page 76: “Cohort 2 students completed the TAKS writing assessment as fourth graders in 2004 and again as seventh graders in 2007…Results for Cohort 2 students show that after controlling for students’ pretest writing scores, student demographic characteristics (gender, ethnicity, economic status), and campus poverty level, there was no statistically significant difference in the 2007 TAKS writing T scores for students in immersion and control schools.”
Excerpt from page 76: “In the third project year, we examined the effects of immersion on Cohort 1 students (eighth graders who attended schools for three years), Cohort 2 students (seventh graders who attended schools for two years), and Cohort 3 students (sixth graders who attended one school year). Key findings are the following:
• TAKS reading. After controlling for student and school poverty, there were no statistically significant effects of immersion on the TAKS reading growth rates for either Cohort 1 or Cohort 2 students.
Excerpts from page 77:”For Cohort 3, after controls for students’ prior achievement, demographic characteristics, and school poverty, there was no statistically significant effect of immersion on students’ 2007 TAKS reading T scores.”
Excerpts from page 77:”TAKS writing. After controlling for Cohort 2 seventh graders’ pretest writing scores (fourth grade), demographic characteristics, and campus poverty, there was no statistically significant difference in the TAKS writing scores for immersion and control students. The immersion effect was negative but not by a significant margin.”
Excerpts from page 92:”Students at immersion schools, compared to control, reported mounting technical problems over time when they used computers at school. Cohorts 1 and 2 immersion students reported increasing technical problems using computers across years compared to control students, with the growth in problems statistically significant for Cohort 1 (eighth graders). Cohort 3 students at immersion schools (sixth graders), who inherited laptops that had been used by students during two previous school years, also reported significantly more technical problems than control group-students.
Excerpts from page 93-94:”Increasing middle school students’ academic achievement in core subjects as measured by state assessments is the ultimate goal of technology immersion…Analyses for Cohort 1 included about 1,380 immersion and 1,600 control students, Cohort 2 included about 1,550 immersion and 1,725 control students, and Cohort 3 included about 1,780 immersion and 1,990 control students.”
Excerpts from page 94:”Technology immersion had no statistically significant effect on students’ TAKS reading achievement. After controlling for student and school poverty, there were no statistically significant effects of immersion on the TAKS reading growth rates for either Cohort 1 (eighth graders) or Cohort 2 (seventh graders).”
Excerpts from page 96:”Similarly, there was no statistically significant immersion effect on the 2006 writing scores for Cohort 1 students who completed writing assessments during the second project year. The immersion effect, similar to Cohort 2, was negative…”
CONCLUSION
In summation, laptops on every student’s desk have not raised academic achievement in reading and writing probably because students are losing valuable class time by doing activities on their computers that may be entertaining but that do not produce solid academic achievement. Legislators need to heed the TIP research, provide state dollars to equip our public schools with adequate computer opportunities for all students without jeopardizing the teacher-student relationship that develops from direct, systematic instruction.
=========================
The Texas Rural Technology (R-TECH) Pilot Program
Second Interim Evaluation Report — February 2010
[Our Texas political leaders are pushing digitized textbooks for our public school students. I say, “Please look at the research.”
Are these politicians looking at the research studies to see whether students are increasing their academic achievement through technology-based learning?
The Texas Technology Immersion Pilot — TTIP (2004-2008) — never could prove that students’ academic achievement had been increased by the $20 Million taxpayers spent on student laptops. (Please see my article posted at the bottom.)
Now we have yet another evaluation from a second technology project called the Texas rural Technology (R-TECH) Pilot Program. It looks as if we are still waiting for the huge expenditures of taxpayers’ dollars on technology — $7.8 Million — to produce higher achievement scores in our Texas students.
Either the technology is not as effective as vendors portray it to be, or the software and/or online programs that students are using with their technology are not rich enough in content to elevate students’ test scores.
I also have to wonder how hard students are working on their “taxpayer-funded technology-based supplemental education programs,” or are students just wasting a great deal of instructional time playing games on their techie toys at taxpayers’ expense?
As I read the following, it seemed to me as if the R-TECH researchers went out of their way to “make excuses” for the lack of increased academic achievement. I bet if the students’ TAKS test scores had increased, none of these supposed “excuses” would have been mentioned in the report.
A final and more inclusive R-TECH report is to be produced in the fall of 2010. I guess we will need to wait for that final report before drawing any definite conclusions. However, it bothers me tremendously that not only are R-TECH students not improving their TAKS scores, but they are even experiencing lowered score results. — Donna Garner]
Introduction to R-TECH
In 2007, the Texas Legislature (80th Texas Legislature, Regular Session, 2007) authorized the creation of the Texas Rural Technology (R-Tech) Pilot program, which provides $8 million in funding to support rural districts in implementing technology-based supplemental education programs…
R-Tech grants were awarded in two periods, or cycles. The Texas Education Agency (TEA) awarded approximately $6.3 million in funding to 64 districts in Cycle 1 grant awards, and $1.5 million in funding to 19 districts in Cycle 2 grant awards…
Grantee districts receive $200 per student served by R-Tech in state funding for each year of the grant and are required to provide matching funds of $100 per student per grant year.
(Excerpts from Pp. IV – VII)
Research Question 4: What is the Effect of R-Tech on Student Outcomes?
The sections that follow present results from analyses of R-Tech on students’ TAKS outcomes. However, test results are a limited indicator of R-Tech program effects because most standardized tests lack the sensitivity needed to measure incremental increases in student achievement produced by supplemental programs such as R-Tech. Given this limitation, readers are asked to consider this report’s findings as preliminary. The evaluation’s final report (fall 2010) will include a broader range of student outcome data, including graduation and attendance rates, advanced course completions, and indicators of college readiness, that were not available at the time of this report’s writing.
The effect of access time. Students who spent more time using R-Tech resources did not experience improved testing outcomes relative to students who spent less time with resources. However, results should be interpreted with caution because researchers were not able to control for unobserved student differences that may have affected outcomes. For example, students who spent more time using R-Tech resources may have been at greater academic risk, requiring more remediation time than students who used R-Tech for briefer periods. If this was the case, then the lack of effect for time spent accessing R-Tech may reflect the characteristics of the students identified for more intensive support rather than the effects of the support itself.
Program type. The small number of districts offering one-to-one tutoring with online instructional support, technology immersion programs, and iPods loaded with instructional content prevented their inclusion in the statistical analysis of program type; therefore, analyses were limited to students participating in self-paced programs and dual credit courses. Students participating in self-paced programs experienced reduced TAKS scores in reading/ELA relative to R-Tech students who participated in other program types; however, self-paced programs had no effect on TAKS outcomes in mathematics, science, and social studies. Again, results should be interpreted with caution because it was not possible to control for the student characteristics that may have caused students to be identified for self-paced programs. If students identified for self-paced programs had more serious academic deficiencies than students identified for other types of R-Tech programs, then results may have been produced by unobserved student characteristics rather than program participation.
Supplemental vs. non-supplemental instruction. Students who received R-Tech services as supplemental instruction offered outside of the regular school day experienced reduced TAKS testing outcomes in social studies relative to students who participated in R-Tech as part of the regular school day (i.e., non-supplemental programs). The effects of supplemental programs on students’ reading/ELA, science, and mathematics were persistently negative, but not by statistically significant levels. These findings suggest that R-Tech services implemented as part of regular instruction may improve students’ TAKS outcomes; however, the characteristics of students identified for supplemental services may have affected outcomes. That is, students identified for supplemental services may have struggled academically, while students participated in non-supplemental services irrespective of academic need, which may indicate that testing outcomes reflect the effects of students’ academic characteristics rather than program participation.
==============================================================================================
4.11.10
“Legislators: Digitized (Computerized) Textbooks Will Not Work”
by Donna Garner
March 17, 2009
During school years 2004 through 2008, the U. S. Department of Education conducted a pilot program in Texas to see whether immersing students in laptop computers would significantly improve student learning. This pilot program (Texas Technology Immersion Pilot — TTIP) cost taxpayers more than $20 million.
Legislators need to pay careful attention to the TTIP conclusions before jumping haphazardly into authoring and passing bills that require school children’s hardcover textbooks to be ditched in favor of computerized versions.
What were the results of the TTIP? What did the taxpayers get for their $20 million? For all that money spent, did student learning improve appreciably?
I read through the lengthy report (Jan. 2009) and have come up with the following succinctly worded conclusions. To verify my statements, please read the entire TTIP report:
Bottomline:
- Even though students were heavily immersed with expensive laptops ($1,100 – $1,600 per student) and teachers were trained extensively in immersion strategies for over four years, little-if-any positive student academic achievement was attained.
- Instead, laptops broke, costing large sums to repair.
- Student self-directed learning did not show positive gains.
- Laptop students during all but the fourth year attended school less regularly.
- Cohorts 2 and 3 did not improve their reading achievement.
- Control group students did better in writing than did the laptop immersed students.
- Cohorts 2 and 3 improved their math scores a bit, but Cohort 1 did not sustain the positive effect into the high-school years.
- Cohort 2 did not improve their 2008 science or social studies scores.
- The researchers concluded, “Given the financial and logistical challenges of implementing and sustaining the Technology Immersion model, statewide implementation may not be possible.”
I stand by my long-held beliefs that nothing will ever take the place of a live teacher working directly and systematically with a live student.
I do believe that certain knowledge-based, academic material can be learned effectively online; and I am the writer/consultant for such an online offering — MyStudyHall.com — that teaches students grammar and other valuable English / Language Arts / Reading (ELAR) skills.
Our excellent online tutorial provides teachers with supplementary units to help students hone their English and communication skills, but we at MyStudyHall.com do not support the granting of course credit for ELAR courses done through distance learning.
So far as I know, none of the TTIP schools utilized our online tutorial; but they should have. Perhaps if they had encouraged their students to “soak” in our in-depth content instead of skipping merrily through the usual TAKS-Prep Lite materials, the immersed laptop students would have improved their scores.
The brain research says that children must connect concepts by experiencing close cognitive progression if they are ever going to move the concepts into long-term memory. MyStudyHall.com provides just that type of instruction by carefully building grammar units that deepen in depth and complexity as students master each new unit.
We at MyStudyHall provide students with a pleasing and accessible way to learn important knowledge-based, academic skills; but it is the teacher who must hold students accountable to use these skills correctly and consistently in their speaking and writing. No computer can do that.
I stand by my contention that it is not a wise use of taxpayers’ dollars to provide laptops for all classroom students; and I do not believe laptops should ever replace the direct, systematic instruction of a teacher working face-to-face with a classroom of students. The Texas Technology Immersion Pilot study confirms my beliefs.
Extrapolating out the results of the TTIP’s findings should also serve to dissuade Legislators who want to do away with hardcover textbooks by replacing them with digitized (computerized) versions.
If Legislators genuinely want to increase public school students’ academic skills, then these policymakers should pay close attention to the results of the $20 million TTIP study. Computerized textbooks delivered on student laptops are not the answer to the educational gaps among our public school students.
Donna Garner
Retired Teacher
============================================================
Evaluation of the Texas Technology Immersion Pilot: Final Outcomes for a Four-Year Study (2004–05 to 2007–08) — January 2009
Prepared for
Texas Education Agency
Prepared by
Texas Center for Educational Research
P.O. Box 679002
Austin, Texas 78767-9002
800.580.TCER (8237)
512.467.3632 512.467.3658 (fax)
http://files.eric.ed.gov/fulltext/ED536296.pdf (link to the full report)
The Technology Immersion Pilot (TIP), created by the Texas Legislature in 2003, was based on the assumption that the use of technology in Texas public schools could be achieved more effectively by “immersing” schools in technology rather than by introducing technology resources, such as hardware, software, digital content, and educator training, in a cyclical fashion over time. The Texas Education Agency (TEA) invested more than $20 million in federal Title II, Part D monies to fund Technology Immersion projects at high-need middle schools through a competitive grant process. Concurrently, a research study partially funded by a federal Evaluating State Educational Technology Programs grant has investigated whether student achievement improved over time through exposure to Technology Immersion. The Texas Center for Educational Research (TCER) was TEA’s partner for a four-year evaluation of the implementation and effectiveness of the Technology Immersion model (p. i).
…Through an expert review process, the TEA selected three lead vendors to provide Technology immersion packages (Dell Computer Inc., Apple Computer Inc., and Region 1 Education Service Center [ESC]). Of the 21 Technology Immersion schools studied in the evaluation, 5 middle schools selected the Apple package, 15 selected the Dell package, and 1 school selected the Region 1 ESC package (with Dell computers) (p. i).
…The fourth-year evaluation provides final conclusions about the effects of Technology Immersion on schools, teachers, and students. This report combines information gathered during the fourth project year (2007-08) with data from the first-through-third implementation years (2004-05 through 2006-07). The study’s quasi-experimental research design has allowed inferences about the causal effects of Technology Immersion through comparisons between 21 treatment schools and 21 control schools (p. ii).
Setting and Participants
The 42 participating schools included Grades 6 to 8 middle schools drawn from rural, suburban, and urban locations across Texas. Middle schools were typically small (about 400 students, on average); however, enrollments varied widely (from 83 to 1,447 students). About two-thirds of schools were located in small or very small Texas districts (less than 3,000 students), and about a third were in very large districts (10,000 or more students). Students in the study were mostly economically disadvantaged (67%) and they were racially and ethnically diverse (roughly 58% Hispanic, 7% African American, and 36% White) (p.ii).
The study focused on three student cohorts in the fourth year. Cohort 2 included eighth graders (2,578 treatment and 2,858 control students) who finished their third immersion year; Cohort 3 included seventh graders (2,547 treatment and 2,845 control students) who concluded their second year. We also examined achievement data for Cohort 1 students (2,469 treatment students and 2,748 control group students) who had attended Technology Immersion and control schools from sixth-through eighth grade and then attended traditional high schools in the fourth year (high schools that typically did not provide individual laptops for students) (p. ii).
…As laptops aged over four years, students at Technology Immersion schools, compared to control, reported more technical problems when they used computers at school. In the fourth year, students in Technology Immersion schools reported technical problems with computers at more than twice the rates reported by control students. Eighth graders (Cohort 2) and seventh graders (Cohort 3) who often inherited second-hand laptops and had used those laptops across school years reported significantly more technical problems than control group-students. Although various technical problems occurred rarely (a few times a year) or just sometimes (once or twice a month), problems with deteriorating laptops substantially increased the workloads of technical-support staff, who often were already overburdened with technical demands (p. iv).
…Technical Problems. Given the increased availability of technology in immersion schools and classrooms, we reasoned that students might encounter more technical problems. Thus, we asked students to indicate on a 5-point scale about how often various Technical Problems happened when they tried to use a computer at school. Across Cohorts 2 and 3, growth rates showed that immersion students reported more technical problems using computers compared to control students. Figure 5.2 shows that Cohort 2 immersion students initially reported fewer technical problems than control students, but by the end of eighth grade, both economically advantaged and disadvantaged immersion students reported more technical troubles (p. 50).
Across four evaluation years, there was no evidence linking Technology Immersion with student self-directed learning or their general satisfaction with schoolwork. Findings from three student cohorts across four evaluation years showed there was no statistically significant effect of Technology Immersion on student Self-Directed Learning, as measured by the Style of Learning Inventory. As both immersion and control students progressed from lower to higher grade levels, their responses to statements measuring self-direction (e.g., goal setting, self-efficacy beliefs, and intrinsic effort) revealed significantly negative growth trends. Similarly, there was no significant difference in the levels of satisfaction with schoolwork expressed by treatment and control students. Across all middle schools, students’ became less satisfied with the meaningfulness and relevance of their schoolwork as they advanced to higher grade levels (pp. iv – v).
Although prior research suggested that the individualized learning opportunities allowed through one-to-one technology would positively affect students’ self-regulated learning, our results, consistent with previous years, revealed no significant immersion effects on Cohort 2 students’ growth in self-direction. As both immersion and control students progressed through eighth grade, their responses to statements revealed significantly negative growth trends…Overall findings indicated that students did not consider themselves to be strongly self-directed learners (pp. 51-52).
…For the first-through-third evaluation years, students at Technology Immersion schools had significantly lower school attendance rates than control students—however, in the fourth year, attendance-rate differences between treatment and control students were smaller and statistically nonsignificant. Unexpectedly, students at Technology Immersion schools attended school less regularly than control students across the first three years (p.v).
…Technology Immersion had no statistically significant effect on TAKS reading achievement for Cohort 2 (eighth graders) or Cohort 3 (seventh graders)—however, for Cohort 1 (ninth graders), there was a marginally significant and positive sustaining effect of Technology Immersion on students’ TAK reading scores. After controlling for student and school poverty, there were no statistically significant effects of immersion on the TAKS reading growth rates for either Cohort 2 or Cohort 3 (p. vi).
…Technology Immersion had a statistically significant effect on TAKS mathematics achievement for Cohort 2 (eighth graders) and Cohort 3 (seventh graders). For Cohort 1 (ninth graders), the sustaining effect of immersion on TAKS mathematics scores was positive but not by a statistically significant margin (p.vi).
Conclusions about the effects of Technology Immersion on TAKS social studies and science scores remain in doubt. However, outcomes for TAKS writing, which involved the administration of the TAKS assessment in traditional paper-and-pencil format, have consistently favored control students although not by statistically significant margins…Available results have revealed no statistically significant differences between treatment and control groups for TAKS social studies, science, or writing scores. Treatment-control group differences for science and social studies have varied from year to year, whereas outcomes for TAKS writing have consistently favored students at control schools. Across evaluation years, seventh graders in immersion schools, on average, have had lower TAKS writing scores…(p. vii).
…Findings from four years suggest that Technology Immersion can be implemented and is sustainable if districts and schools are committed to the model—however, other approaches to technology use may be appropriate for some districts and schools. Over four years, it became evident that Technology Immersion involved more than just buying laptops for students. Technology Immersion is a comprehensive model for transforming the school culture, and the nature of teaching and learning, and expanding the educational boundaries of the school. This study shows that fundamental school change is difficult and requires a long-term commitment at all levels of the school system (board members, superintendent, principals, teachers, students, and parents). Given the financial and logistical challenges of implementing and sustaining the Technology Immersion model, statewide implementation may not be possible. However, those districts and schools that are committed to Technology Immersion should have state support for their innovative school-reform efforts. At the same time, other districts and schools should receive support for alternative technology initiatives that have research-based evidence of effectiveness (p. xi).
…Through an expert review process, the TEA selected three lead vendors as providers of Technology Immersion packages (Dell Computer Inc., Apple Computer Inc., and Region 1 Education Service Center [ESC]). Package costs, which ranged from about $1,100 to $1,600 per student, varied according to the numbers of students and teachers, the type of laptop computer, and the vendor provider. Of the 21 immersion sites studied in the second through fourth years, 5 middle schools selected the Apple package, 15 selected the Dell package, and 1 school selected the Region 1 ESC package (Dell computer) (p. 17).
Conclusions – Student Achievement (p. 71)
In the fourth and final project year, we examined the effects of Technology Immersion on Cohort 2 students (eighth graders who attended middle schools for three years), Cohort 3 students (seventh graders who attended middle schools for two years), and Cohort 1 students (ninth graders who attended middle schools for three years and then enrolled in mainly traditional high schools). Key findings are the following.
• TAKS reading. After controlling for student and school poverty, there were no statistically significant effects of immersion on the TAKS reading growth rates for either Cohort 2 students or Cohort 3 students. The immersion effects were positive but very small. Across both student cohorts, positive mean growth trajectories showed that economically disadvantaged students and students in schools with above average levels of poverty grew in reading achievement at faster rates than their more affluent peers. For Cohort 1, post immersion and control ninth graders attending high schools, there was a positive enduring effect of Technology Immersion on treatment students’ TAKS reading growth rate that approached statistical significance (p < .0.06).
• TAKS mathematics. After controlling for student and school poverty, Technology Immersion had a statistically significant effect on the TAKS mathematics growth rates for both Cohort 2 and Cohort 3 students. The TAKS mathematics scores of immersion students increased across years, whereas scores for control students decreased. For Cohort 1, post-immersion and control ninth graders attending high schools, there was a positive but statistically nonsignificant sustaining effect of Technology Immersion on TAKS mathematics achievement.
• TAKS science. After controlling for prior science achievement, demographic characteristics, and school poverty, there was no statistically significant effect of immersion on Cohort 2, eighth graders’ 2008 TAKS science scores. The estimated immersion effect was positive but very small.
• TAKS social studies. After controlling for Cohort 2, eighth graders’ reading achievement (seventh grade), demographic characteristics, and school poverty, there was no statistically significant effect of immersion on 2008 TAKS social studies scores. The estimated immersion effect was virtually zero (.006 T-score point).
• TAKS writing. After controlling for Cohort 3 seventh graders’ pretest writing scores (fourth grade), demographic characteristics, and campus poverty, there was no statistically significant difference in the TAKS writing scores for immersion and control students. The estimated immersion effect was negative but very small.